SigmaPlot helps you create graphs using Excel spreadsheets and present your results as PowerPoint presentations. Its user interface includes Microsoft Office style ribbon controls. The tabbed window interface efficiently organizes your worksheets and graphs for easy selection.
SigmaPlot provides all the fundamental tools you need to analyze your data from basic statistics to advanced mathematical calculations. Simply click the View Column Statistics button to instantly generate summary statistics including 95% and 99% confidence intervals.

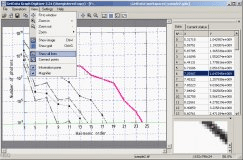
GetData Graph Digitizer gets raw data of visual graphs for analytical purposes

A useful tool to compare Excel spreadsheets' values and formulas automatically.
Comments (5)