SigmaPlot helps you create various kinds of graphs and statistical plots using given data. This program offers the flexibility to customize every detail of your graph. You can add axis breaks, standard or asymmetric error bars, and symbols. You can also change colors, fonts, line thickness, etc. Simply double-click on any graph element to launch the Graph Properties dialog box, where you can easily change various properties and values; the change is immediately graphed on your screen.

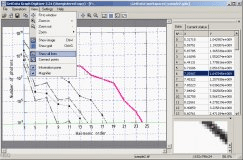
GetData Graph Digitizer gets raw data of visual graphs for analytical purposes

A useful tool to compare Excel spreadsheets' values and formulas automatically.
Comments (5)