Create precise 2-D and 3-D graphs for exact data visualization. Take control of every detail in the built charts and graphs. Share your creations on the Web.
SigmaPlot is a powerful and comprehensive scientific graphing and statistical analysis platform for Windows. It offers unparalleled capabilities for creating complex graphs and for performing in-depth data analysis and visualization tasks.
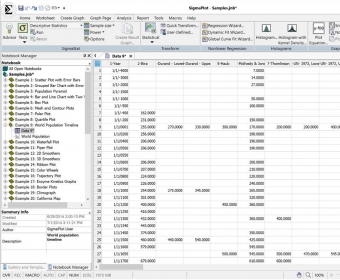
SigmaPlot makes creating and editing graphs a simple and effective job, regardless of how complex are the graphs. The intuitive interface allows organizing the workflow in a really effective manner, especially thanks to elements such as the tabbed windows or the Office-style ribbon controls. High-quality graphs can be produced in a rather short amount of time and the seamless Microsoft Office integration allows you to easily access data from Microsoft Excel spreadsheets and display your results in Microsoft PowerPoint presentations.
This impressive tool allows the creation of a large variety of graph types. More than 100 2-D and 3-D technical graph types are supported. Furthermore, every little detail of the charts and graphs can be configured to your liking, including axis breaks, colors, fonts, line thickness, etc.
This application is so powerful and feature-rich that it would take days to describe all of its functions, tools and features. It can basically plot any mathematical function and it offers support for more than 50 popular statistical tests. Considering that it’s also easy-to-use, this tool simply represents the perfect solution for anyone in need to create detailed graphs or perform thorough statistical analyses.


Comments (5)