v15.0 [Dec 12, 2022]
New Graph Type (via Macro)
- Heat Map.
UI Modifications for Improved User Experience
- New and Refreshed Ribbon Manager.
- New Home Button.
- Separate Macros Tab.
- Expanded Help.
- Ribbons Configuration functionality available
Quick Access Tab.
- Histograms group on Analysis Tab.
- New Tools Tab.
- Dot Density Macro.
Analysis Features
- Result Graphs.
- User-Defined Transform Dialog.
Miscellaneous Items
- Changed Clipboard Format for Excel to
CF_SYLK.
- New Licensing System.
- Removed older Microsoft VS 2005 Redistributable.
v14.0 [Aug 14, 2015]
New Graph Features
- Arrows with solid arrowheads.
- Added a right mouse menu command for pasting copied graph primitives (arrow, box, etc.) on the page.
- A common operation on a graph is to zoom in, make a modification and then zoom out. A toggle was added, Ctrl 3, between your current zoom level and 100%.
- Data sampling dropdown now shows the maximum number of rows in the column.
- Mini-toolbars for left mouse selection may be turned off.
- An Anti-aliasing button has been added to the Graph Page Tab, Format Group.
- Improved user interface for the Color Schemes dialog.
- The “Each Curve” option is automatically turned on when performing a linear regression on one plot.
- Additional Plot Regression Statistics.
- Improved access to result graphs following statistical analysis – obtained by right clicking either a statistical report or another result graph.
- The scatter matrix graph, used to display results of some statistical tests such as correlation, has increased support from 10 variables previously up to 40 variables.
- Graph Properties can now be obtained by right clicking a graph or plot.
- Renamed the Linear Regression command in the Graph Analysis group of the Analysis tab to Plot Regression.
- Text and special symbols options are now shown directly on the symbols dialog.
- The Graph Additions Group Name has been changed to Manage Plots.
- Multiple Result Graph Types May Now Be Simultaneously Selected from the Create Result Graph Dialog.
- The default appearance of all Result Graphs has been improved.
- Added TIFF gray scale export option for graphs and graph pages.
- A Page Templates button has been added to the Format group of the Graph Page ribbon tab.
New Worksheet Features
- Sorting data in the worksheet now supports multiple key columns.
- Coefficient of Variation and 90% Confidence Interval added to Column Statistics.
- Formatted text can now be used in statistical analyses.
- Custom Column Statistics Items and Order May Now be Specified.
- Statistical procedures may now use data from over 4000 worksheet columns.
New Analysis Features
- The One-Way Frequency Tables method has been added.
- The unpaired (aka 2-independent samples) t-test has been enhanced to provide options to test the equality of the populations means of the two groups without assuming equal variances (Welch’s t-test).
- Ctrl-A now selects all program lines in user defined transforms.
- More nonlinear regression application examples have been added that can now be accessed from the Help menu.
- Improvements to the transforms examples that can now be accessed from the Help menu.
- Improvements to some ape (automatic parameter estimate) functions in the Transform Language.
- The number of groups for computing dummy variables has been extended from 100 to 1000.
- Increased the maximum character length of labels in statistical tables from 30 to 255.
- Error Message and Partial Save Nonlinear Regression Improvements.
- The User-Defined Transform and Regression Dialogs are Now Resizable and can be Saved.
- Improved User Interface for the Quick Transforms dialog.
New Miscellaneous Features
- Unicode is now supported.
- Automatic Updating is available within SigmaPlot to get the latest updates to features.
- User settings are now preserved for new versions of SigmaPlot.
- Added new ribbon layouts for different types of workflows.
- The Export button is also on the Main button.
- New Macro Method for Exporting any Graph Page Selection.
- Added a Save All command to the Main Button.
- Two New Macros Using Indexed Data for Graphing.
- Sample Data Sets Available from Help.
- New Macro Automation Method to Determine a Worksheet Column Length.
- Added File Import and Import Database to the Main Button panel for more visible access.
- Data Can Now be Extracted from a Result Graph.
v13.0 [Aug 6, 2014]
Graph Features
- Forest Plot
- Kernel Density Plot
- Added 10 Color Schemes
- Dot Density Graph with mean and standard error bars
- Legend Improvements
Analysis Features
- Principal Component Analysis (PCA)
- Analysis of Covariance (ANCOVA)
- Added P values to multiple comparisons for non-parametric ANOVAs
- Removed the combo box choices for multiple comparison significant levels and tied the significance level of multiple comparisons to the main (omnibus) test
- Added the Akaike Information Criterion to Regression Wizard and Dynamic Fit Wizard reports and the Report Options dialog
- Added back the Rerun button in the SigmaStat group
- Updated the fit library standard.jfl
User Interface Features
- Rearrange Notebook items in a section by dragging
- Added SigmaPlot tutorial PDF file
- Line widths from a worksheet column
Import/Export Features
- Added the SVG and SWF file formats for scalable vector graphics export
- Added Vector PDF export to improve on the existing raster PDF
- File import and export support is added for Versions 13 and 14 of Minitab, Version 9 of SAS, Version 19 of SPSS and Version 13 of Symphony
v12.5 [Mar 5, 2013]
1. Graph Properties Dialog
- Dynamic Update provides immediate graph redraw with a property change. No clicking on "Ok" or "Apply" required
- The combination of V11 and V12 gives you the intuitive properties panels of V11 and the immediate graph response of V12
- The Graph/Plot/Axis tabs are now gone. All Graph Properties items are now grouped into the fixed two-level tree shown below on the left. All items previously existing in those tabs can now be viewed at one time in this one tree.
- Clicking a tree node on the left displays on the right all properties associated with that node in V11 format
- Each graph on the page and the axes and plots for that graph may be selected in the Graph Properties Current group (upper right) without closing Graph Properties
- Different items on the page may be selected without closing Graph Properties. For example, you may zoom in to a portion of the graph while Graph Properties is open. Also with Graph Properties open you can select a different graph on the page to edit simply by clicking on it.
- The Graph Properties panel becomes partially transparent when you move your cursor off the panel allowing you to see through the panel the immediate change that just occurred
- The Graph Properties panel is smaller than that in Version 11 thus requiring less window real estate
2. Microsoft Office Style Ribbons
- Context sensitive feature grouping for enhanced functionality and ease of use.
- Expanded tooltips that include hot keys.
- High resolution button icons.
- Alt Key Tips provide visual display of keyboard shortcuts.
3. User Interface Improvements
- Tabbed window views enables quick window management (selection, closing, grouping)
- Docking panel guides providing simple window placement. This includes the Graph Gallery, Templates, Layouts, Object and Properties windows
- Group open windows into tabbed groups either vertically or horizontally. This groups like windows for easier comparison and better window management.
- Object-specific mini toolbars are displayed adjacent to selected graph, worksheet and report objects. This allows faster editing of object properties.
- Customizable Quick Access Toolbar for frequently used user-specific controls
- Window show/hide buttons for improved window real-estate management
4. Improved Graph Page Navigation
- Zoom, pan, +/- controls and zoom dialog & slider always available on status bar.
- Drag and position graphs with "hand" mouse cursor.
- Quick window scrolling with middle mouse wheel.
5. Graph Export Improvements
- Vector PDF format has been added
- Improved EPS
6. Worksheet Improvements
- Mini tool bar for quicker worksheet cell editing
- Zoom enabled worksheets
- Quicker worksheet window scrolling using mouse wheel
- Formatted text in worksheet cells. Text in worksheets can contain super and subscripts, Greek letters, etc. plus they can be also used in tick labels
7. Report Improvements
- Insert tables with pre-defined styles or customize them completely to your preference
- Copy/Paste tabular data bi-directionally between SigmaPlot reports and Excel worksheets
- Zoom enabled report pages
- Vertical and horizontal rulers in graph windows
- Ability to change the report background color
- Explicit icon in Graph Output ribbon for frequently used PDF export which is enhanced with a new report engine
- Drag and Drop Word 2007 and Word 2010 content directly onto the report page
8. Curve Fitting Features
- Weight variables may now be specified quite generally as functions of the parameters. Therefore these weights will change at each iteration. In special cases, this includes weighting by predicted values, weighting as a function of residuals (for robust regression) and weighting as a function of the parameters (for error modeling).
- Parameter covariance matrix and parameter confidence intervals added to nonlinear regression reports
- Implicit function curve fitting gives the ability to compute predicted values that are defined implicitly by the fit model
- The fit windows for equations, parameters, etc. are now expandable to allow entry of long equations
9. Statistics Features
- One Sample Signed Rank Test
- Deming regression allows for errors in both x and y variables a technique used in method comparison
- Normal distribution comparison with graph and statistics for preliminary quality control analysis
- Parallel line analysis to determine if linear regression slopes and intercepts are different
- Bland-Altman graph and statistics for method comparison
- Improvements in post-hoc testing for multi-factor ANOVAs including P-values for Dunnett´s test and more accurate statistics for multiple comparisons in 3-Way ANOVA
10. Analysis and Transform Language Features
- Enzyme kinetics analysis module is now included with SigmaPlot Version 12
- Worksheet row and column titles may now be set from the Transform language statements
- Root() and Implicit() functions for solving implicit equations
v12.1 [Apr 27, 2011]
- Export to graphic formats when using Antialiasing, gradient fills and transparency
- Copy and Paste to MS Excel, MS Word and MS Powerpoint when using Antialiasing, gradient fills and transparency
- Stability of the Program
- Refresh issues in the graph page when changing properties in the Property Browser
- Updating of the Property Browser when making changes on the graph page
- Macro recording of the Property Browser
- Help for Quick Transforms, Macros and the Introductory chapter
- Date and Time axis scales
- Macro operation of the following macros:
- Ligand Binding
- Exploratory EK
- Label Symbols
- Dot Density
- F test comparison of curves
- Display of graphs in the Gallery
- Pasting of dates into reports
- Hand Cursor panning
- Tool tips in the Ribbon
- Opening Excel files
SigmaPlot Macro Library summary descriptions:
- Error Bars display
- Copy and Paste styles in Property browser
- Second plot creation in radar graph
- Radar graph Error and Area band color display
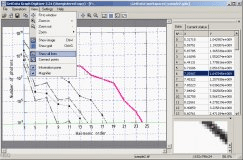
GetData Graph Digitizer gets raw data of visual graphs for analytical purposes

A useful tool to compare Excel spreadsheets' values and formulas automatically.