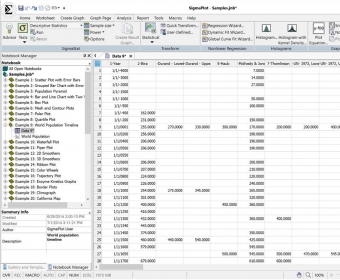
SigmaPlot makes it easier for you to present your findings accurately using precise, publication-quality graphs, data analysis and presentation tools. SigmaPlot offers numerous scientific options such as automatic error bars, regression lines, confidence intervals, axis breaks, technical axis scales, nonlinear curve fitting and a data worksheet for powerful data handling.
SigmaPlot is a state-of-the-art technical graphing program designed for the Windows platform. It is certified for Microsoft Office 98, 2000, Windows Vista, Windows XP, and Windows 7. SigmaPlot is specifically designed to aid in documenting and publishing research, specializing in the graphical presentation of results.
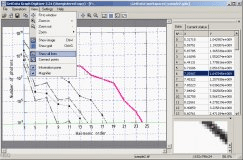
GetData Graph Digitizer gets raw data of visual graphs for analytical purposes

A useful tool to compare Excel spreadsheets' values and formulas automatically.


Comments (5)