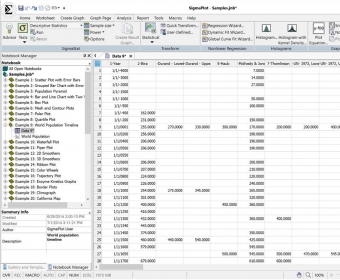
Sigma Plot is heavy-weight robust statistical application, able to provide the user with useful and easy-to-read statistical reports. Most Excel users might not be impressed about the graphic features of the program, but when it offers an automatic calculation for a specific graphic (Standard Curve Analysis), then the good, old Excel is a mere data base worksheet.
Some of its first hand tools are: Statistics (Rates and Proportions, Repeated Measures), Transforms (Smooth 3D Data, Lagged Variables), ROC Curves, Pharmacology (Exploratory Enzyme Kinetics, Simple Ligand Binding). Although the program can handle itself independently from Excel by using its own workbook format, you can work with all Excel formats with it (xls, xlsx). You can open the data from an Excel file or you can have Excel opened into SigmaPlot and work on the data origin file (Excel) and then work the statistical analysis in the same window.
All statistical enthusiasts will receive this application with open arms, and those that are required for strange Excel reports can take advantage of its executive graphic presentations, which can be printed right away.
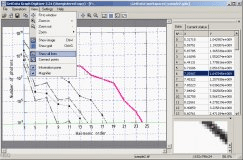
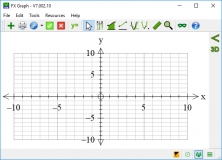
GetData Graph Digitizer gets raw data of visual graphs for analytical purposes

A useful tool to compare Excel spreadsheets' values and formulas automatically.


Comments (5)